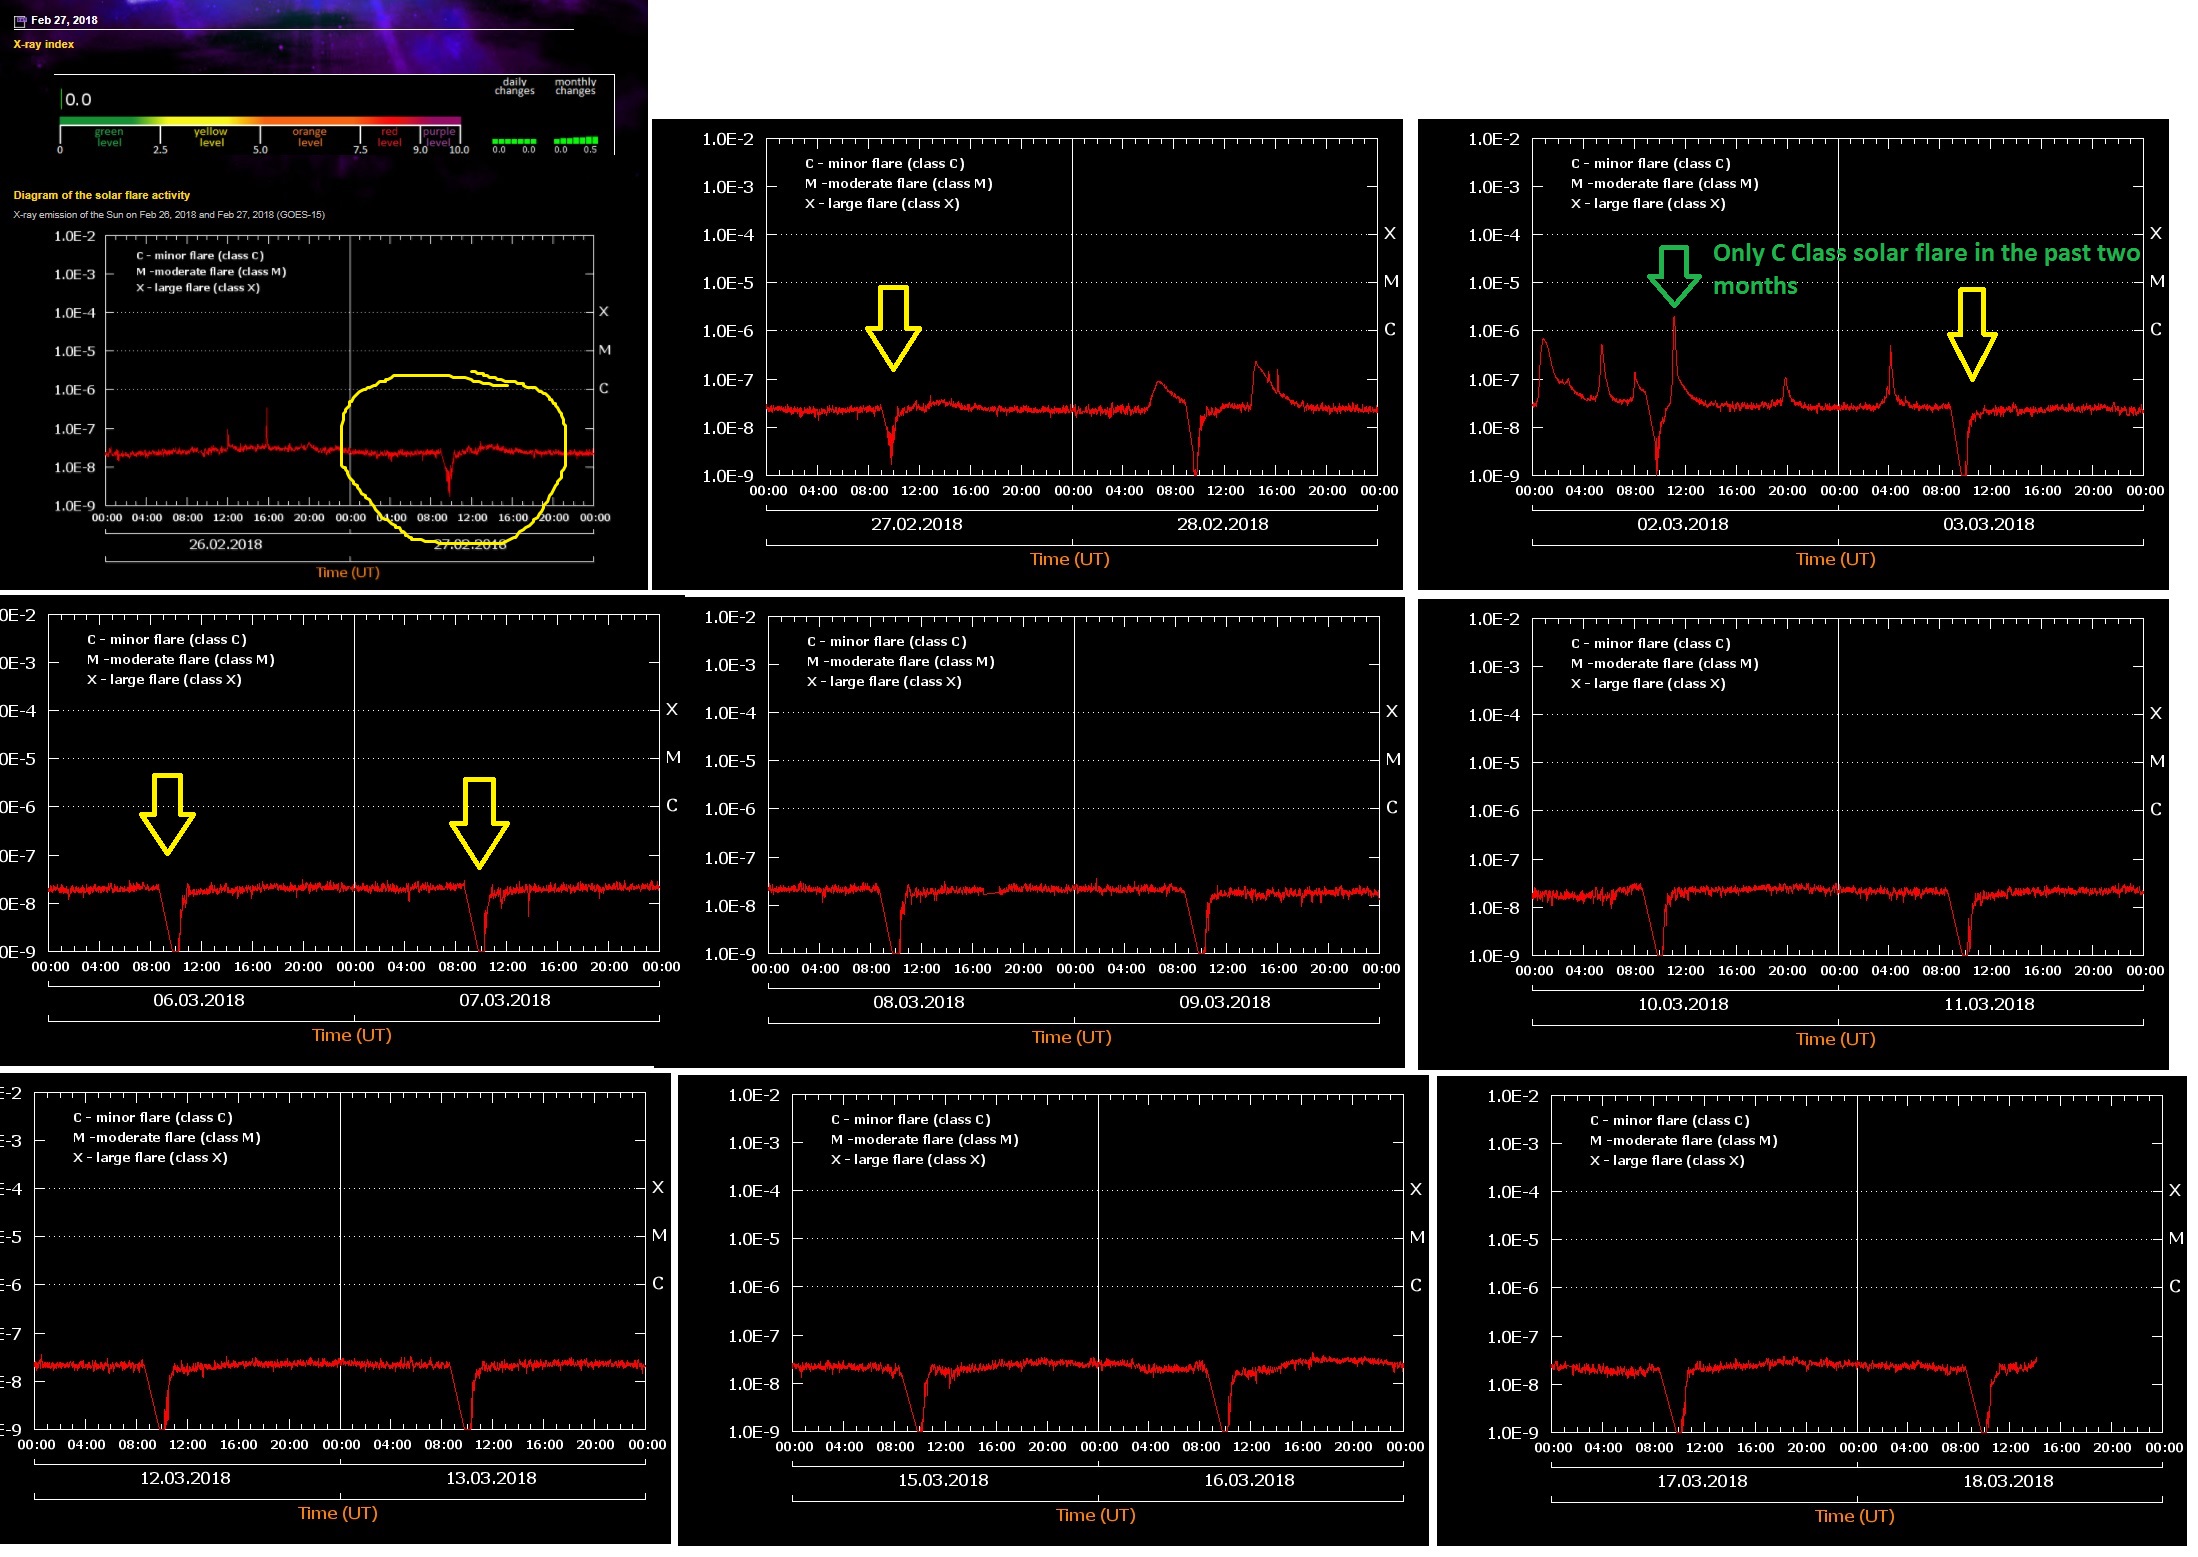
So there I was, just perusing through various solar data sites looking to verify some crazy report I’d been sent by a viewer. First stop for solar base info for me is always the Russian Solar site, Tesis Lebedev as their information is presented in a very concise easy to find way and lets face it, when it comes to “space”info, the Russians are far more reliable than NASA or NOAA, lol.
I’d been over at the Tesis site last week when I recorded/wrote the article “The Mega Solar Storm that isn’t” and I noticed this blip in the info, but as I was busy running in circles with a million other things, I quickly forgot about looking into it. So today, when I went into Tesis to check some geomagnetic graphs, I remembered the questions I had last week and I took a few minutes to investigate….
I have been watching these graphs for YEARS, so when something unusual comes up in the graphs they jump out at me right away- and this was one of those weirdness moments. When looking at the Solar Flare graph last week I noted that for the 4-5 days worth of graphs I checked, they all had the same “dip” at the exact same time every day. I’ve NEVER seen this before. Today I back tracked the “Dip” and I’ve found the start date on it- February 27 2018 was the very first time this “dip” in the graphs showed up, starting at approx. 8:30amUTC , peaking at 10am, and finishing at a little after 11am UTC. As I said, I have NEVER seen this red line “dip” down before- flares show as a spike upwards on the graph….. so what is the opposite of a solar flare?

EVERY. SINGLE. DAY.
I wondered if it was an annual anomaly, some bizarre bobble in a satellite orbit, so I tried to back track to March/Feb 2017, except from Dec 28 2016 to May 24th 2017 ALL the flare data is gone!
So My Friends, my questions are: What is happening every day between 8am till 11am UTC since Feb 27 2018? And what is the opposite of a “solar flare”?
Any thoughts? Theories? Facts or Data? Let me know!
d


